Car accident rates vary dramatically across U.S. cities, with some metropolitan areas experiencing significantly higher fatal crash rates per 100,000 residents than others. Understanding which cities face the greatest traffic safety challenges—and why certain cities perform better—provides critical insights for drivers, policymakers, and urban planners nationwide.
This analysis covers the cities with the most car accidents nationally, examining both total accident volume and per capita safety rates, with a detailed focus on New York City’s accident patterns, rankings, and the factors that make it one of the safer major cities despite its massive traffic volume.
Understanding Car Accident Statistics by City
Car accident data is measured and reported in several ways, each revealing different aspects of traffic safety. Understanding these measurement methods is essential for meaningful city comparisons, as raw numbers alone can be misleading when comparing a city of 600,000 residents to one with 8.5 million.
Fatal Crash Rate Measurements
Deaths per 100,000 residents is the standard metric for comparing traffic fatalities across cities of different sizes. This per capita approach allows meaningful comparison between Memphis (population ~630,000) and New York City (population ~8.3 million). A city with 50 fatal accidents may actually be far more dangerous than one with 200, depending on population.
Population density affects crash statistics in nuanced ways. Denser, mixed-use urban areas tend to have more interactions between vehicles, pedestrians, and cyclists, which increases collision frequency but typically limits speeds. Lower speeds generally mean fewer fatalities, even when total accidents are higher—a critical distinction when evaluating safety.
Total Accident Volume vs. Safety Rates
Large cities like NYC may have high total accident numbers but significantly lower per capita rates. New York City reports over 200,000 motor vehicle crashes annually, yet its fatality rate remains among the lowest for major cities. This paradox exists because dense urban environments, lower speed limits, and high public transit usage reduce the severity of crashes even when frequency remains high.
The connection between infrastructure, public transit availability, and accident prevention is well-documented. Cities with extensive public transportation systems have lower per-capita car dependency, which directly reduces the number of vehicles on the road and, consequently, the opportunities for fatal crashes.
Cities with the Most Car Accidents Nationwide
Ranking cities by accident rates requires a consistent methodology. The following analysis draws from studies covering 2019-2023 data, focusing on cities with populations exceeding 200,000 and using NHTSA crash data combined with local reporting.
Top 10 Cities with the Highest Fatal Crash Rates
Memphis, Tennessee, leads U.S. cities with the highest fatal crash rate at approximately 25.96 deaths per 100,000 residents—a rate more than seven times higher than New York City’s. The factors contributing to Memphis’s dangerous status include sprawling road networks with high speed limits, limited public transit options, and roadways designed primarily for vehicle throughput rather than pedestrian safety.
Southern cities dominate the list of most dangerous places for drivers, representing a disproportionate share of high-fatality locations. Cities like Little Rock, San Antonio, Fort Worth, Oklahoma City, and Kansas City, Missouri, appear frequently on dangerous-city rankings. Key factors contributing to this regional pattern include a more sprawling geography, higher-speed rural roads within city limits, lower public transit usage, and, in some cases, less investment in pedestrian infrastructure.
Risk factors that elevate fatal crash totals in these cities include drunk driving, distracted driving, excessive speeding, and reckless driving—behaviors that prove more deadly on high-speed arterial roads common in Sun Belt and Rust Belt cities.
Major Metropolitan Areas by Total Accident Volume
When examining the total number of crashes rather than per capita rates, the largest cities naturally report the highest volumes. Los Angeles, Houston, Phoenix, Dallas, and New York City consistently lead in total crash counts. However, these raw numbers reflect population size rather than inherent danger.
For perspective, Houston’s total annual accidents may be lower than NYC’s in absolute terms, yet Houston’s fatality rate per 100,000 residents is roughly three to four times higher. This distinction between volume and severity is crucial for accurately identifying high-risk areas.
New York City Car Accident Analysis
New York City’s traffic safety record provides a compelling case study in how urban policy, infrastructure design, and enforcement can dramatically reduce traffic fatalities despite enormous traffic volume. The city’s 2025 statistics mark historic achievements while revealing persistent challenges that still demand attention.
NYC Accident Statistics and Trends
NYC ended 2025 with 205 traffic fatalities, the lowest number since record-keeping began in 1910. This represents a 19% decline from 253 deaths in 2024 and a 31% decline since Vision Zero launched in 2014.
Quarterly and mid-year trends show sustained improvement:
- First quarter 2025: 41 deaths (down from 65 in Q1 2024)
- First half 2025: 87 fatalities (32% fewer than the 128 deaths through June 2024)
Borough-level crash patterns reveal important geographic differences:
| Borough | Approximate Q1 2025 Crashes | Fatality Change 2024-2025 |
|---|---|---|
| Brooklyn | ~6,241 | -9% |
| Queens | ~4,800 | -23% to -38% |
| Manhattan | ~3,200 | -11% |
| Bronx | ~2,900 | -39% |
| Staten Island | ~1,136 | Slight increase |
Brooklyn reports the highest collision counts, while Staten Island, with more suburban-style roads featuring higher speeds, shows the least improvement and remains relatively dangerous per capita.
Time-of-day patterns indicate evening hours (5 PM to midnight) present the highest risk for serious injuries and fatalities. Rush-hour congestion, while frustrating, may actually reduce fatality risk by limiting speeds; it’s the post-rush evening period when speeds increase and impaired driving rises that proves most deadly.
Most Dangerous Areas Within New York City
Fatal crashes and serious injuries concentrate on wide, multi-lane arterial roads where speed limits reach 30 mph or higher and distances between crosswalks are greater. These roadways were designed primarily for vehicle throughput, often at the expense of pedestrian safety.
High-risk corridors and intersections include:
- Queens Boulevard (historically nicknamed “Boulevard of Death,” though safety improvements have reduced fatalities)
- FDR Drive and major highway on-ramps
- Atlantic Avenue in Brooklyn
- Major bridge approaches, where merging traffic creates blind spots and conflict points
Pedestrian deaths cluster in areas with wide roadways, long crossing distances, and limited pedestrian infrastructure. Brooklyn and Queens contain numerous such corridors, while Manhattan’s denser street grid with more frequent crosswalks tends to be safer for pedestrians despite higher foot traffic.
Contributing Factors to NYC Accidents
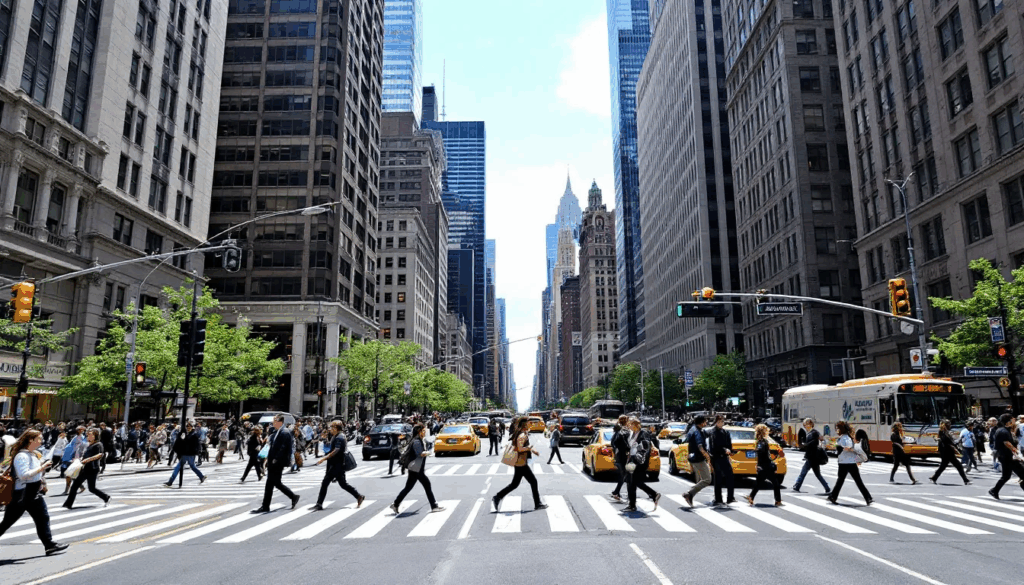
New York City’s unique urban environment creates specific driving challenges: dense traffic, constant pedestrian and cyclist presence, complex intersections, and the psychological pressure of navigating alongside millions of other road users.
Leading causes of NYC crashes include:
- Driver inattention/distraction: ~5,322 crashes attributed to distracted drivers in early 2025 data
- Failure to yield right-of-way: ~1,387 crashes
- Following too closely: ~1,319 crashes
- Speeding: A persistent danger despite 24/7 speed camera enforcement
Speeding enforcement data reveals both progress and challenges. Since NYC expanded speed camera operation to 24/7 in 2022, violations have dropped approximately 30%. However, repeat offenders remain a significant problem, with certain vehicles (“ghost vehicles” with obscured plates) evading enforcement entirely.
Drunk driving and impaired driving contribute to fatalities at lower rates in NYC compared to national averages, likely due to extensive public transit and ride-sharing options that reduce the need for impaired individuals to drive themselves. However, DUI crashes that do occur are disproportionately fatal.
NYC vs. Other Major Cities Comparison
| City | Fatal Crashes per 100k | Total Annual Accidents | Public Transit Usage | Vision Zero Program |
|---|---|---|---|---|
| NYC | ~2.4-3.6 | 200,000+ | High | Yes |
| Los Angeles | ~6.8 | 150,000+ | Low | Yes |
| Chicago | ~8.1 | 120,000+ | Medium | Yes |
| Houston | ~10-12 | 95,000+ | Low | No |
| Philadelphia | ~7-9 | 60,000+ | Medium | Yes |
Philadelphia’s traffic death rate in 2023 was reported as “nearly three times that of New York’s,” despite Philadelphia having a more established urban core. The difference lies partly in enforcement intensity and infrastructure investment.
Why NYC outperforms other major cities:
- An extensive subway and bus network reduces car dependency
- Lower average vehicle speeds due to congestion and design
- Aggressive Vision Zero enforcement since 2014
- Ongoing infrastructure investment in protected bike lanes and pedestrian spaces
- Cultural acceptance of public transit as primary transportation
Next Steps
To help avoid car accidents, city drivers should take these actionable steps:
- Practice defensive driving techniques: maintain following distance, scan intersections, and anticipate other drivers’ mistakes
- Avoid high-risk times: evening hours (5 PM-midnight) present elevated danger in most cities
- Use navigation apps that route around high-accident corridors and provide real-time traffic data
- Eliminate distractions: distracted driving remains a leading cause of crashes across all cities
- Always wear seat belts and ensure all passengers are properly restrained.
Legal Representation for Car Accident Victims
If you are involved in a car accident in New York City and suffer injuries, contacting the Law Offices of Nicholas E. Tzaneteas can be an important step in protecting your rights and pursuing compensation. Depending on the circumstances of your accident, the firm can help evaluate whether you have a viable claim, gather evidence, work with medical providers, and navigate complex insurance issues. With experience handling serious auto accident cases, the office advocates on your behalf to pursue damages for medical expenses, lost wages, pain and suffering, and other losses, while guiding you through each stage of the legal process and negotiating with insurers to seek a full and fair recovery.
Additional Resources
- NYC Department of Transportation Vision Zero Dashboard: Real-time crash data, safety project updates, and borough-specific statistics
- National Highway Traffic Safety Administration (NHTSA) FARS Database: Comprehensive city comparison tools for fatal motor vehicle crashes
- State-specific traffic safety resources: DMV defensive driving programs, traffic safety courses, and accident reporting tools